Custom Dashboards
Build custom analytics dashboards with charts, metrics, and tables. Visualize your data and share dashboards with specific roles.
Custom Dashboards let you build analytics views tailored to your data. Combine chart widgets, metric cards, and data tables into role-specific dashboards that update in real-time.
Key capabilities:
- Three widget types: Charts, Metrics, and Tables
- Drag-and-drop layout with resizable widgets
- Role-based sharing (view or edit access)
- Automatic data caching with manual refresh option
Creating a Dashboard
Navigate to Dashboards in the sidebar. Click Create Dashboard to get started.

In the creation dialog:

- Name: Descriptive name (e.g., "Sales Overview", "User Analytics")
- Share with Roles: Optionally grant access to specific roles with View or Edit permissions
Widget Types
Supamode supports three main types of widgets, each designed for different data visualization needs:
1. Chart Widgets
Chart widgets are perfect for displaying trends and comparisons with various visualization types including bar charts, line graphs, and area charts. They're ideal for showing data like sales over time, user growth, or performance metrics.
Chart Type Selection
When creating a chart widget, you'll first choose what story you want to tell with your data:

Available Chart Types:
- Compare values (Bar chart): Best for comparing categories side-by-side (e.g., Sales by region, products by rating, users by plan)
- Show trends over time (Line chart): Perfect for tracking changes and patterns (e.g., Revenue growth, user signups over months, website traffic)
- Show cumulative totals (Area chart): Great for showing accumulation or composition (e.g., Total revenue over time, stacked user types, budget vs spending)
Each chart type includes helpful examples and use cases to guide your selection.
Chart Configuration
Once you've selected your chart type, you'll configure the specific data relationships:

Chart Configuration Options:
What story do you want to tell?
- Select from predefined chart types like "Show trends over time (Line chart)"
- Each type is optimized for specific data storytelling scenarios
What data do you want to show?
- What do you want to compare?: Choose the category field (e.g., "Created At" for time-based comparisons)
- What do you want to measure?: Select the metric to visualize (e.g., "Count of records")
Chart Value Calculations:
- Count how many: Count the number of records in each category (recommended for most use cases)
- Advanced Options: Select specific columns for more complex calculations
- Intelligent Guidance: The system explains that "Only 'Count' works when measuring all records" and suggests selecting specific columns for additional options
Chart Preview:
- "This will show" section provides a preview of what your chart will display
- Real-time feedback helps ensure your configuration produces the desired visualization
This guided approach makes it easy to create meaningful charts without needing to understand complex data visualization concepts.
2. Metric Widgets
Metric widgets display single key performance indicators (KPIs) calculated from your data. Examples include "Total Users: 1,247", "Average Order Value: $85.50", or "New Sign-ups This Month: 342". These widgets can include trend comparison capabilities.
3. Table Widgets
Table widgets show your data in rows and columns, similar to the powerful tables in the Resources pages. They include sorting, filtering, and detailed record viewing capabilities - perfect for displaying lists of customers, orders, or any detailed records.
Table Widget Configuration
Table widgets offer extensive customization options to display exactly the data you need:

Table Configuration Features:
Data Source Selection:
- Schema & Table: Choose from your database schemas and tables (e.g., "public" schema, "Posts" table)
- Flexible Data Access: Connect to any table in your database for comprehensive data display
Column Selection:
- All Columns by Default: Initially displays all available columns from the selected table
- Selective Display: Click on specific columns to show only the ones you need
- Column Types: View column metadata including:
- Id (uuid): Unique identifiers
- Slug (character varying): URL-friendly identifiers
- Title (character varying): Text content
- Status (user-defined): Custom status fields
- Content (text): Large text content
- Smart Filtering: Easily identify and select the most relevant columns for your use case
Sorting Options:
- Optional Sorting: Configure default sort order for your table
- Sort by Column: Choose any column as the primary sort field
- Flexible Display: Option to display with no default sorting
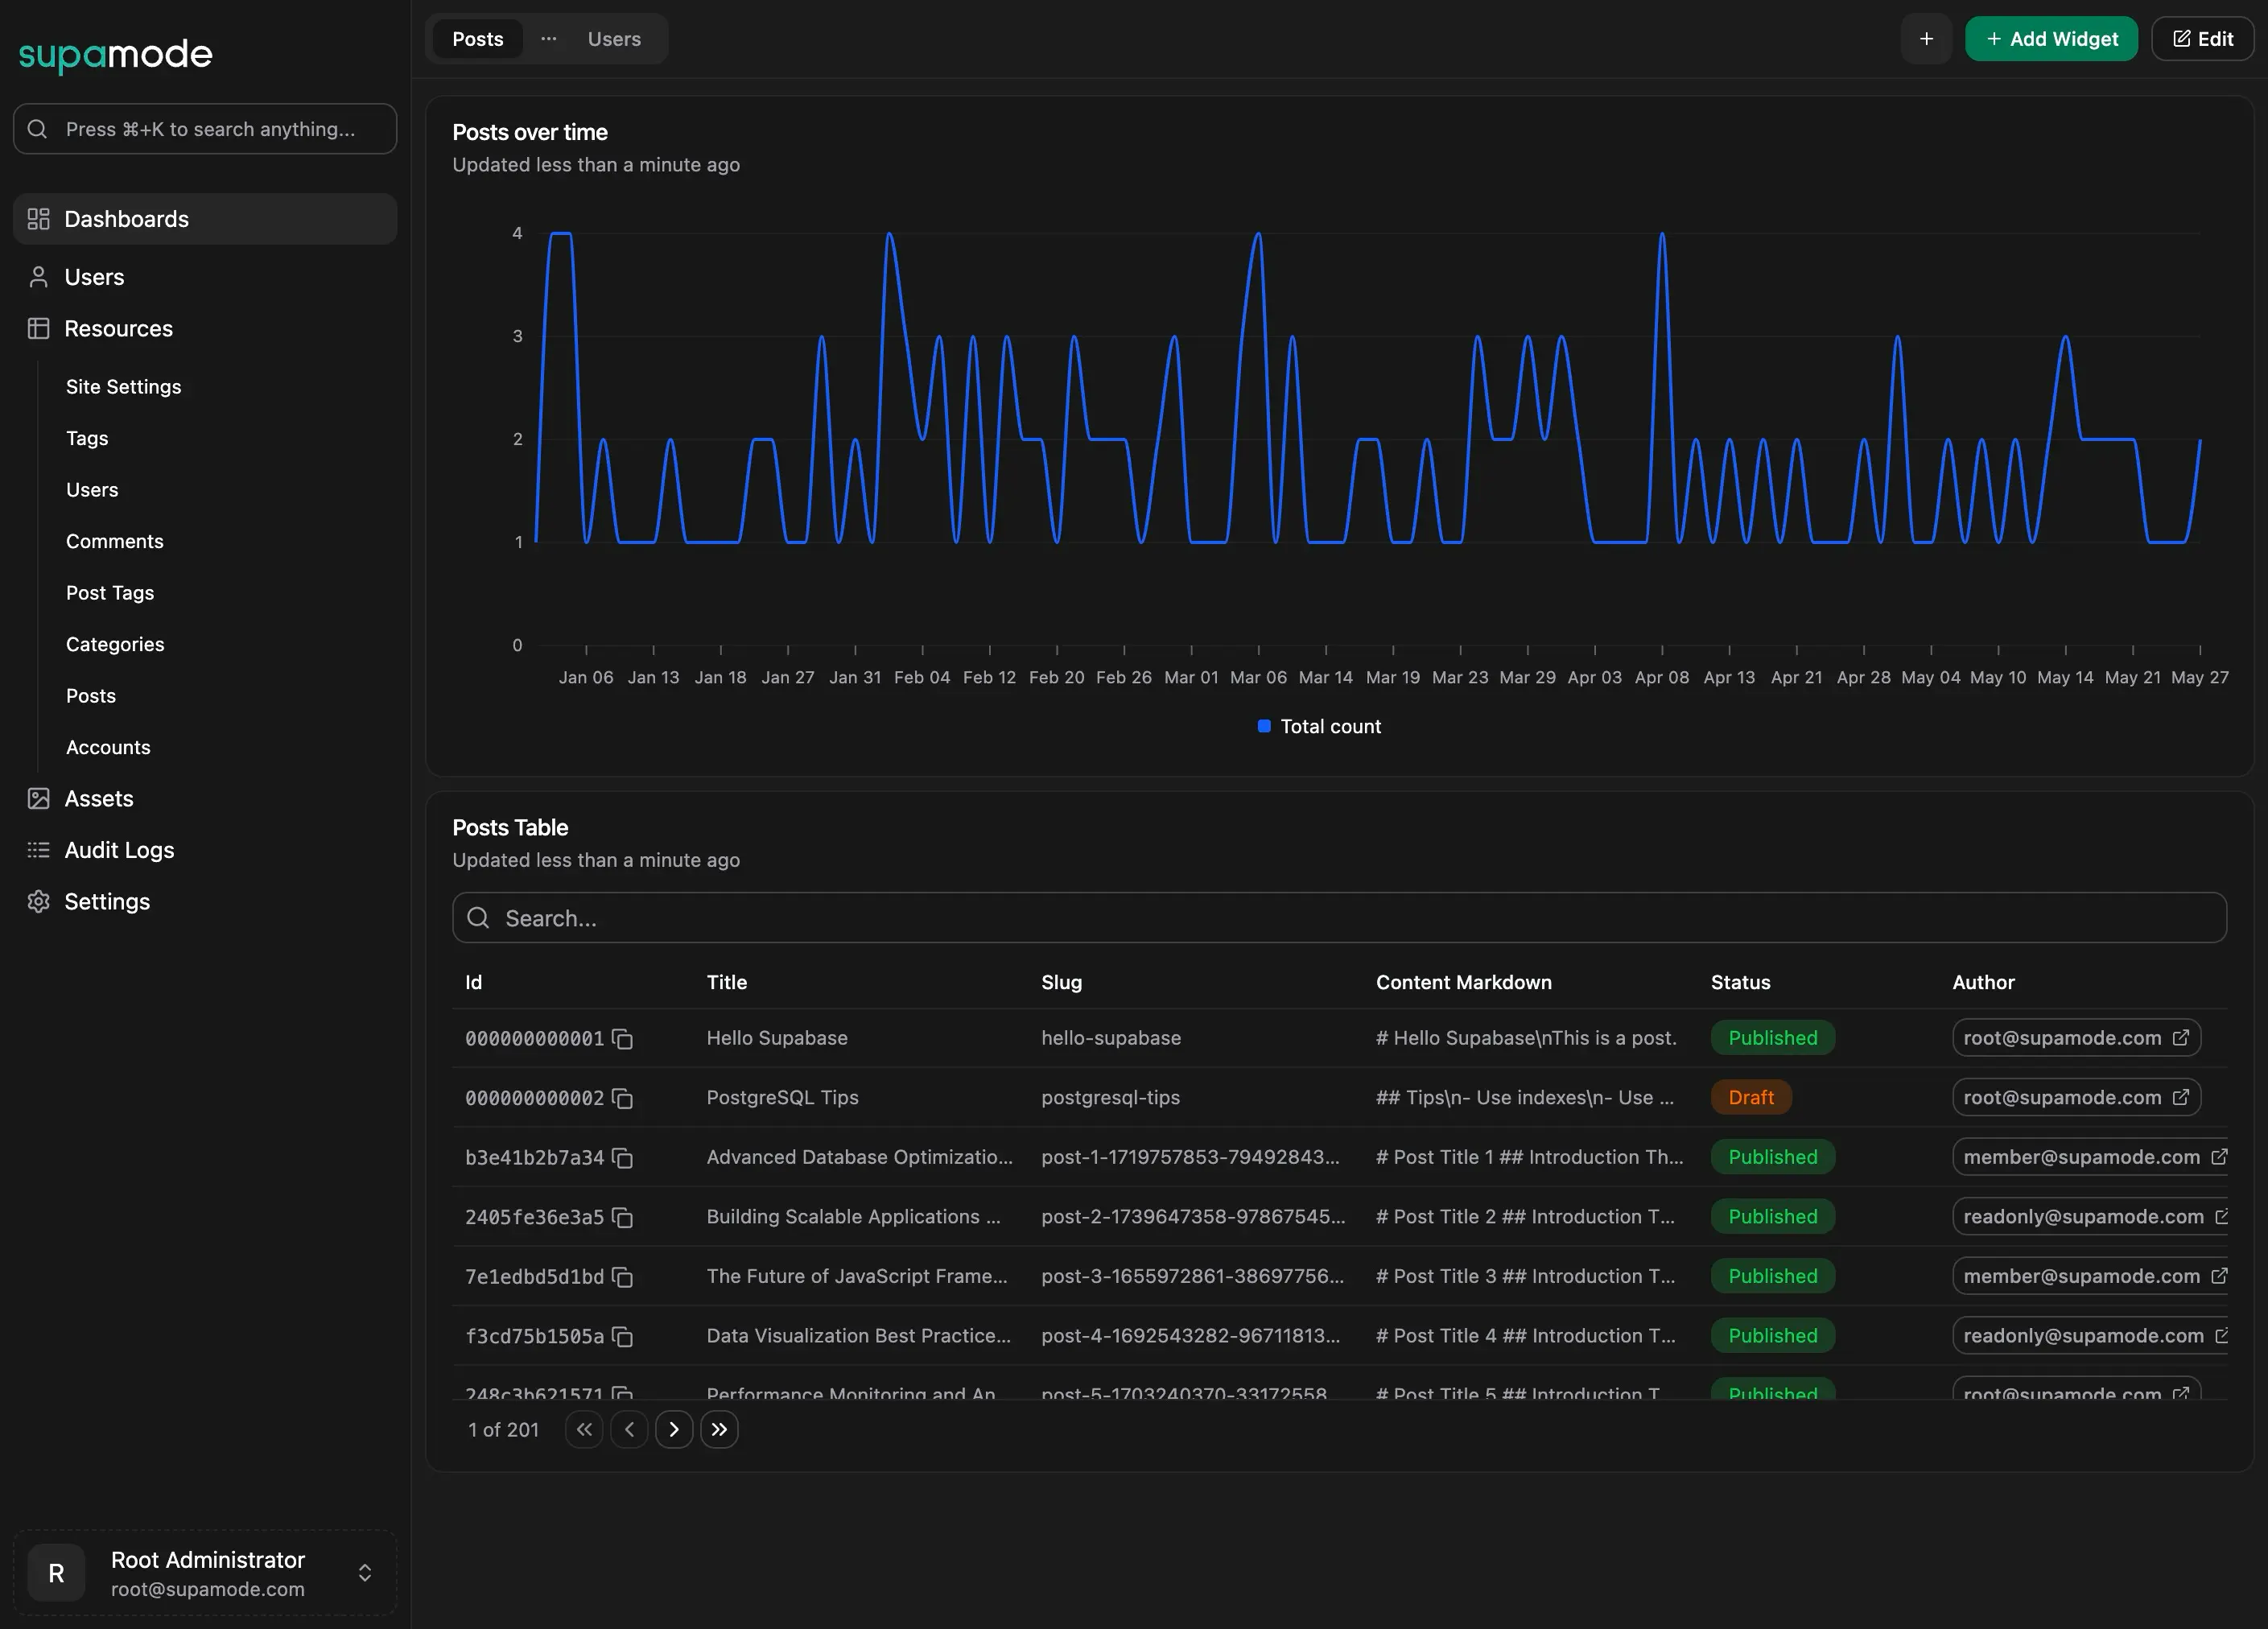
Multiple Widgets Dashboard
Supamode dashboards truly shine when you combine multiple widget types to create comprehensive analytical views:

Powerful Multi-Widget Capabilities:
Chart and Table Combination:
- "Posts over time" Chart Widget: Line chart showing posting trends with real-time data updates
- "Posts Table" Widget: Comprehensive table view with full Data Explorer functionality
Table Widget Power Features:
- Search Functionality: Built-in search bar to quickly find specific records
- Multiple Columns: Display comprehensive data including:
- Id: Unique record identifiers with copy functionality
- Title: Full record titles (e.g., "Hello Supabase", "PostgreSQL Tips")
- Slug: URL-friendly identifiers
- Content Markdown: Preview of content with markdown formatting
- Status: Visual status indicators (Published, Draft) with color coding
- Author: User information with external links
- Pagination: Handle large datasets with "1 of 201" style pagination controls
- Interactive Elements: Clickable elements and external link indicators
- Real-time Updates: Both widgets show "Updated less than a minute ago" timestamps
Dashboard Integration Benefits:
- Unified View: Combine high-level trends (charts) with detailed data (tables) in one interface
- Data Explorer Functionality: Table widgets provide the same powerful capabilities as the standalone Data Explorer
- Cross-Widget Insights: Correlate chart trends with detailed table data for comprehensive analysis
- Efficient Workflow: Switch between overview and details without leaving the dashboard
This multi-widget approach transforms your dashboard into a comprehensive data analysis workspace, combining the best of both visualization and detailed data exploration in a single, unified interface.
Creating Widgets
Widget Creation Wizard
The widget creation process is guided through a 4-step wizard that makes it easy to build exactly the widget you need.

Step 1: Widget Information
- Widget Name: Provide a descriptive name (e.g., "User Registration Stats")
- Widget Type: Choose between Chart Widget (selected), Metric Widget, or Table Widget
- Each type includes helpful descriptions of their use cases
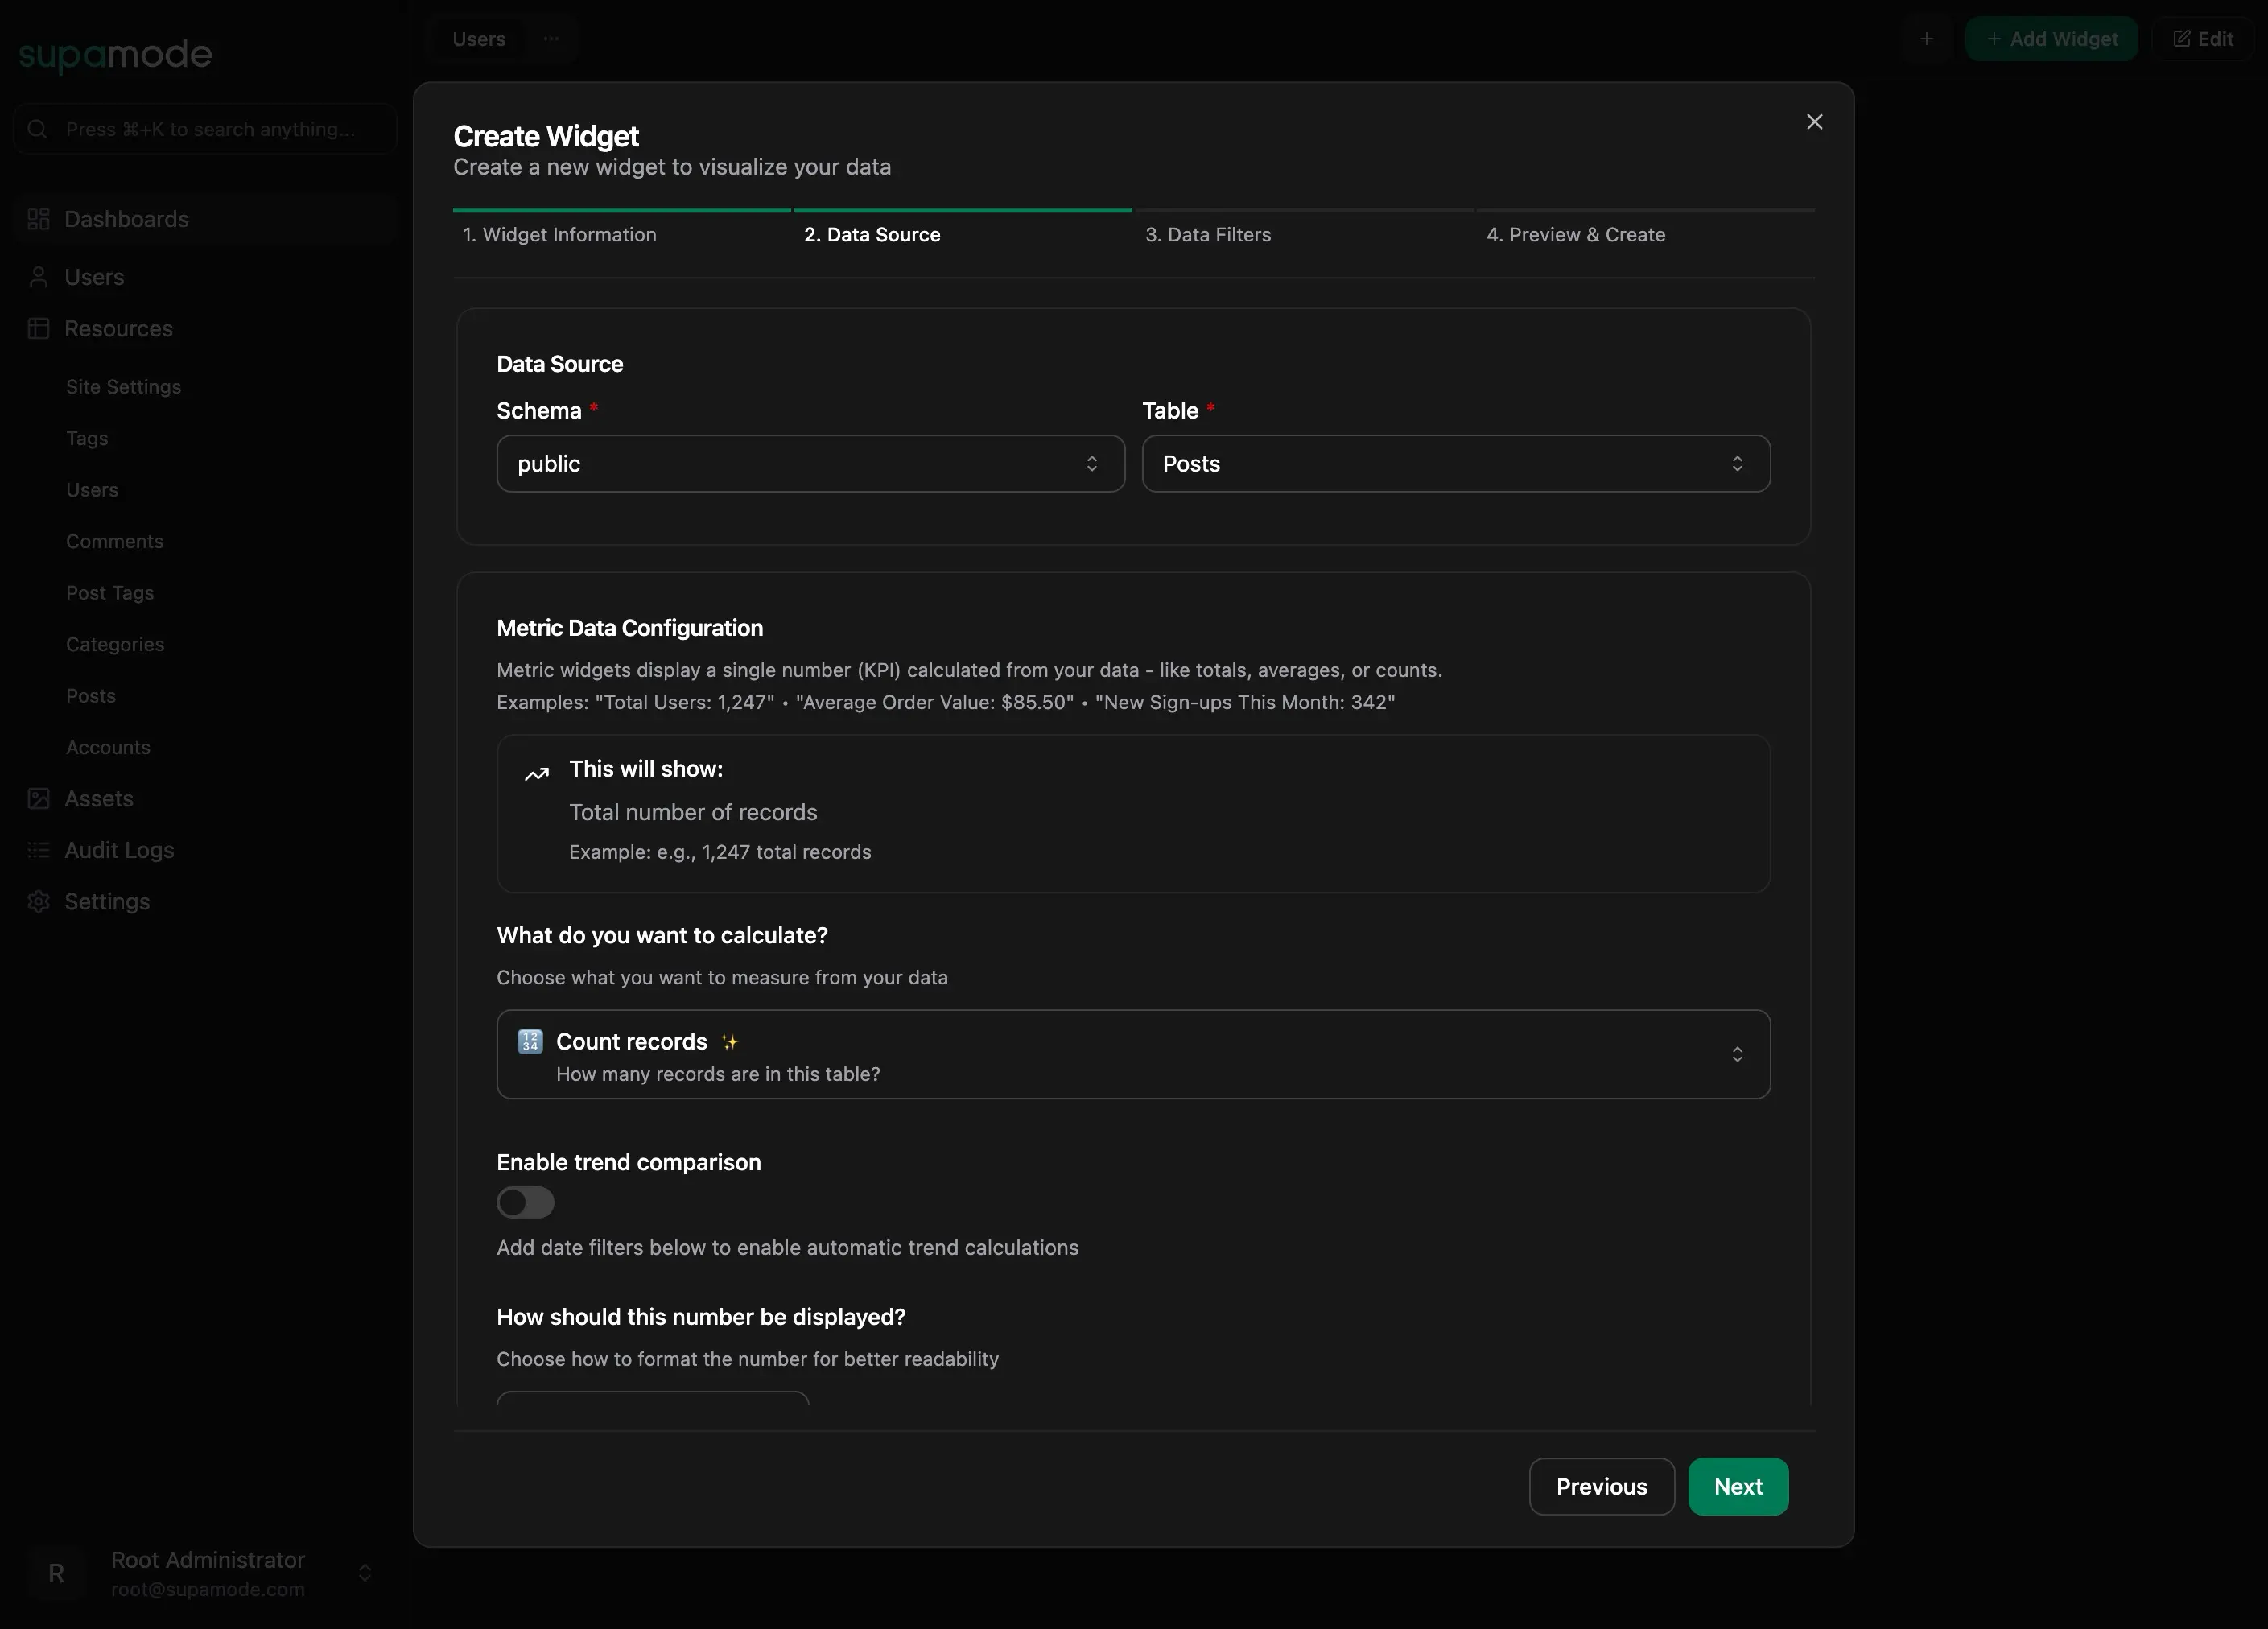
Data Source Configuration
Step 2: Data Source Configure which data your widget will display by selecting:
- Schema: Choose the database schema (e.g., "public")
- Table: Select the specific table (e.g., "Posts")

For Metric widgets, you'll also configure:
- Calculation Type: Choose what to calculate (Count records, Sum values, Average, etc.)
- Trend Comparison: Enable to show change over time periods
- Number Formatting: Choose how to display the metric value
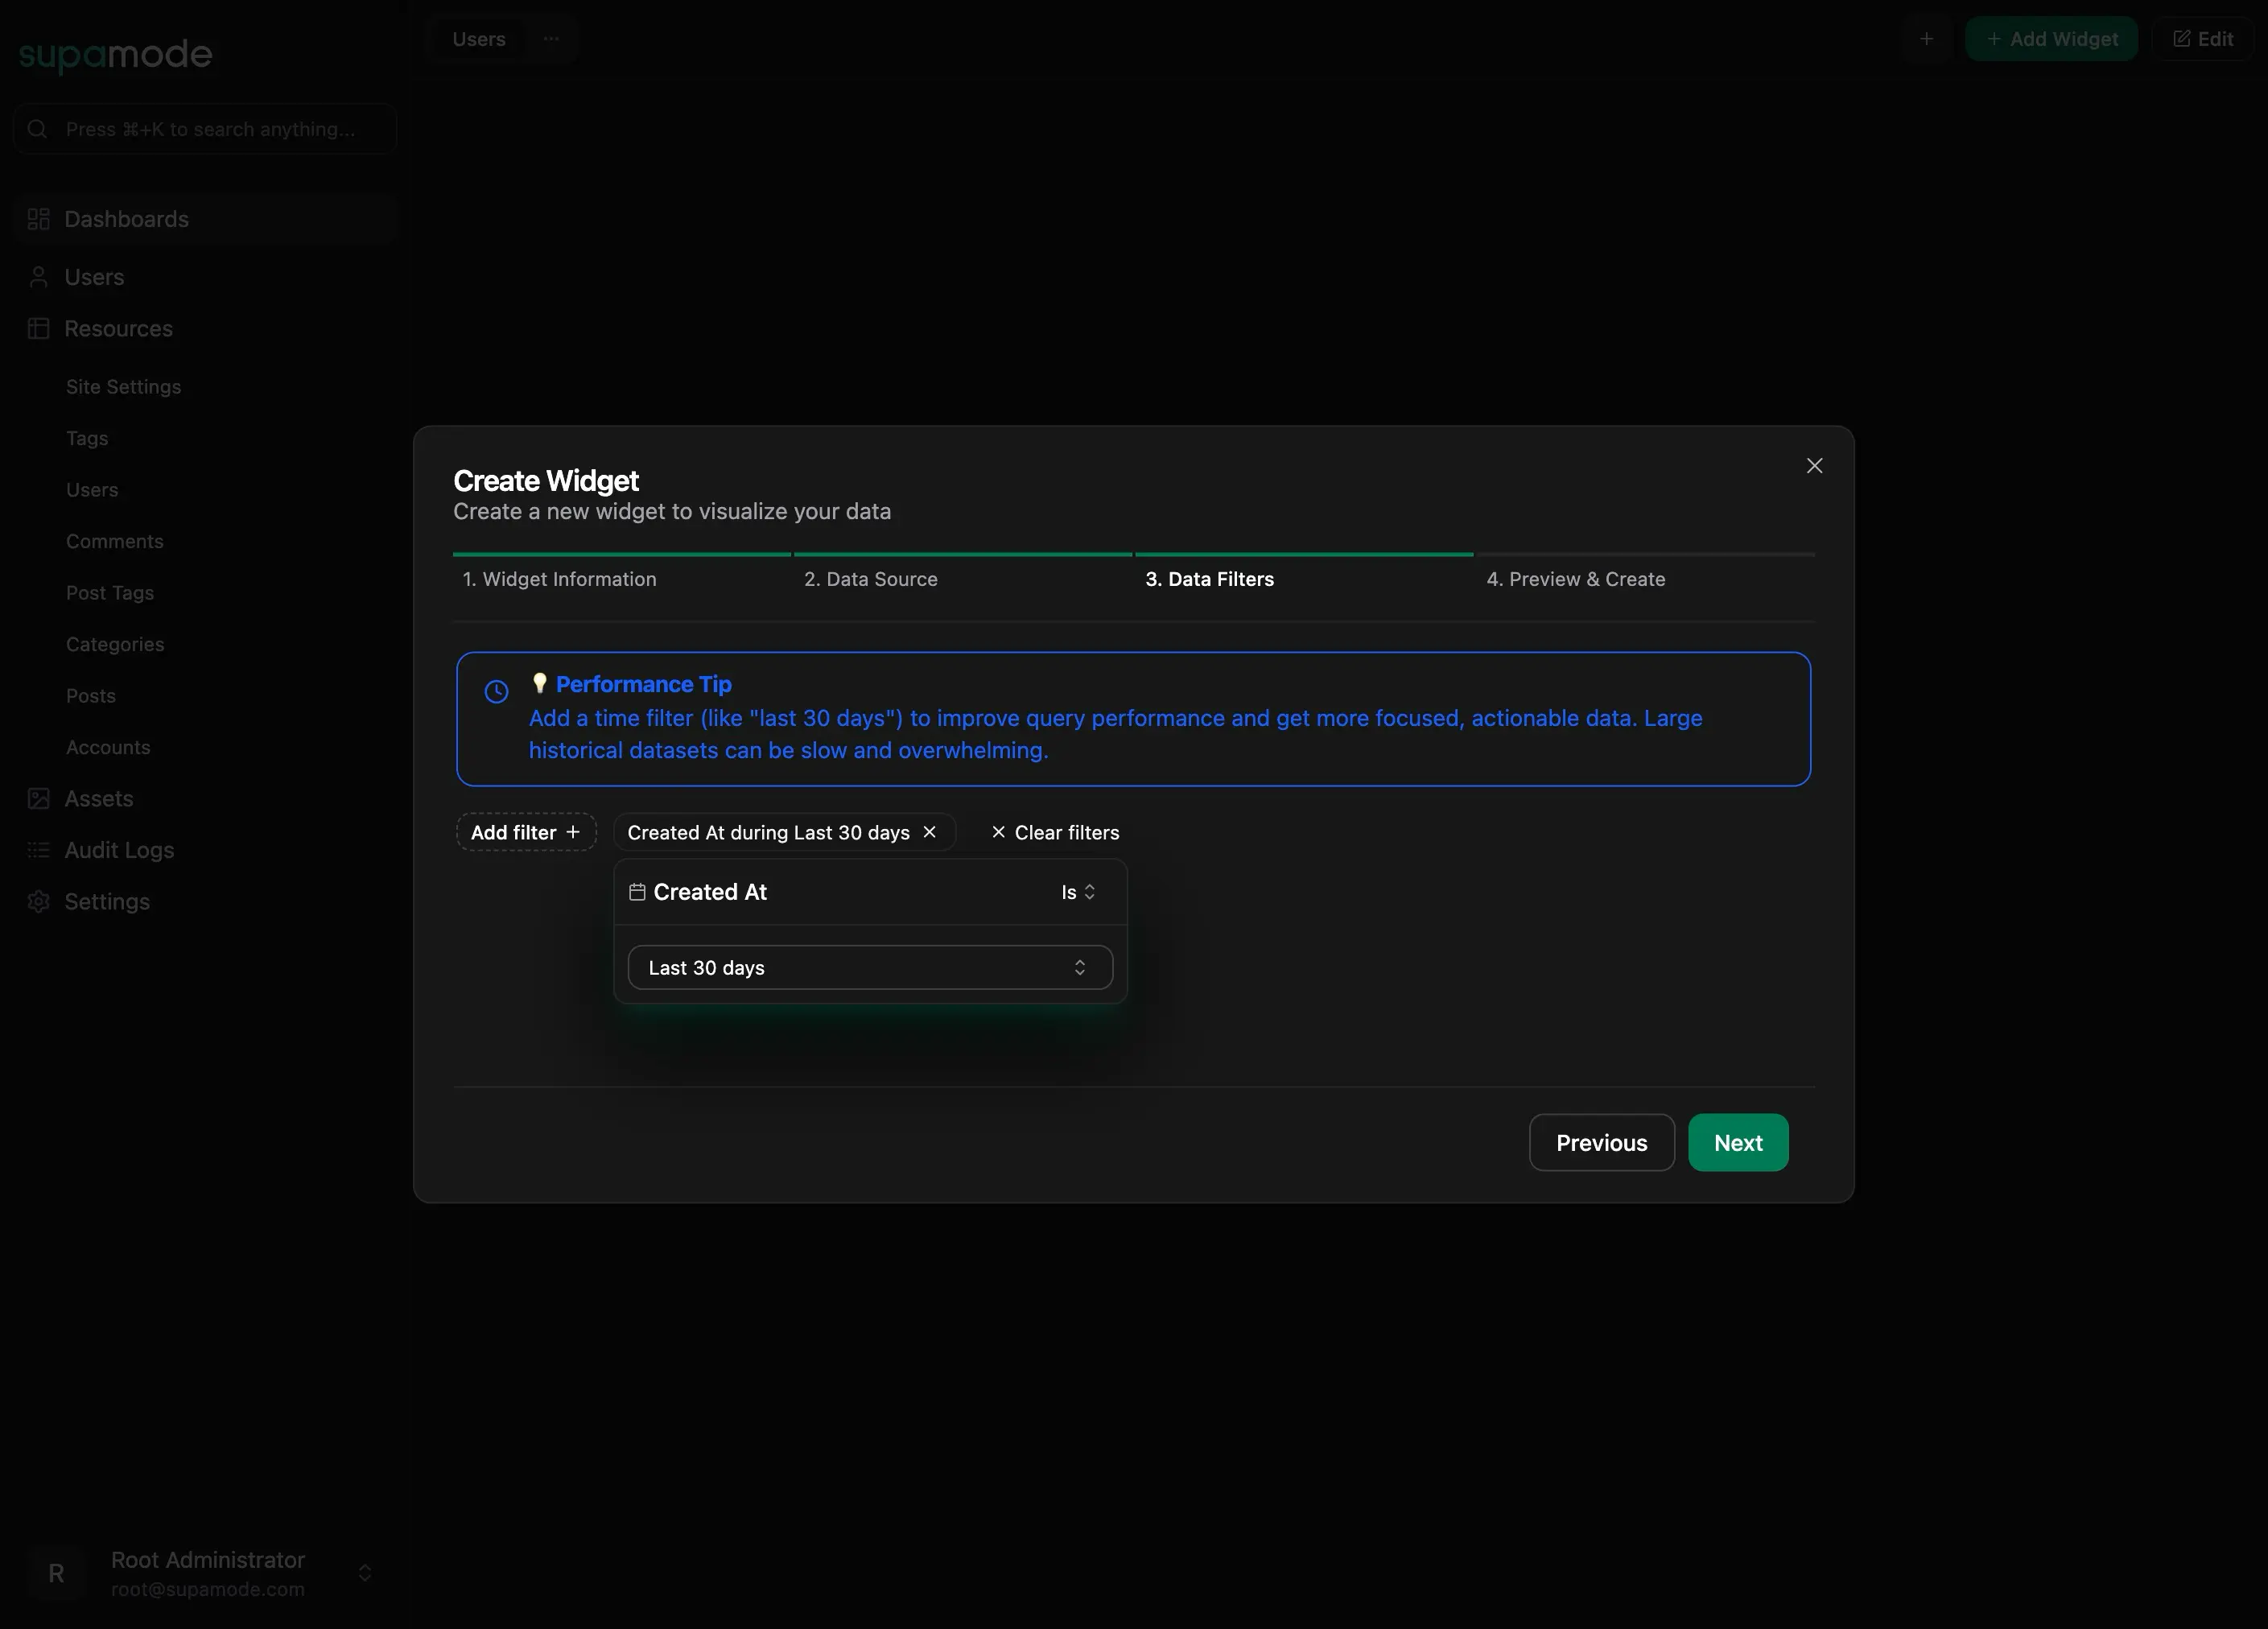
Data Filters
Step 3: Data Filters Apply filters to focus your widget on specific data subsets. The system provides intelligent performance recommendations.

Features:
- Performance Tips: Automatic suggestions like adding time filters ("last 30 days") to improve query performance
- Filter Options: Add filters for any column with appropriate operators
- Date Filters: Built-in support for relative date ranges (Last 30 days, This month, etc.)
- Clear Filters: Easy option to remove all applied filters
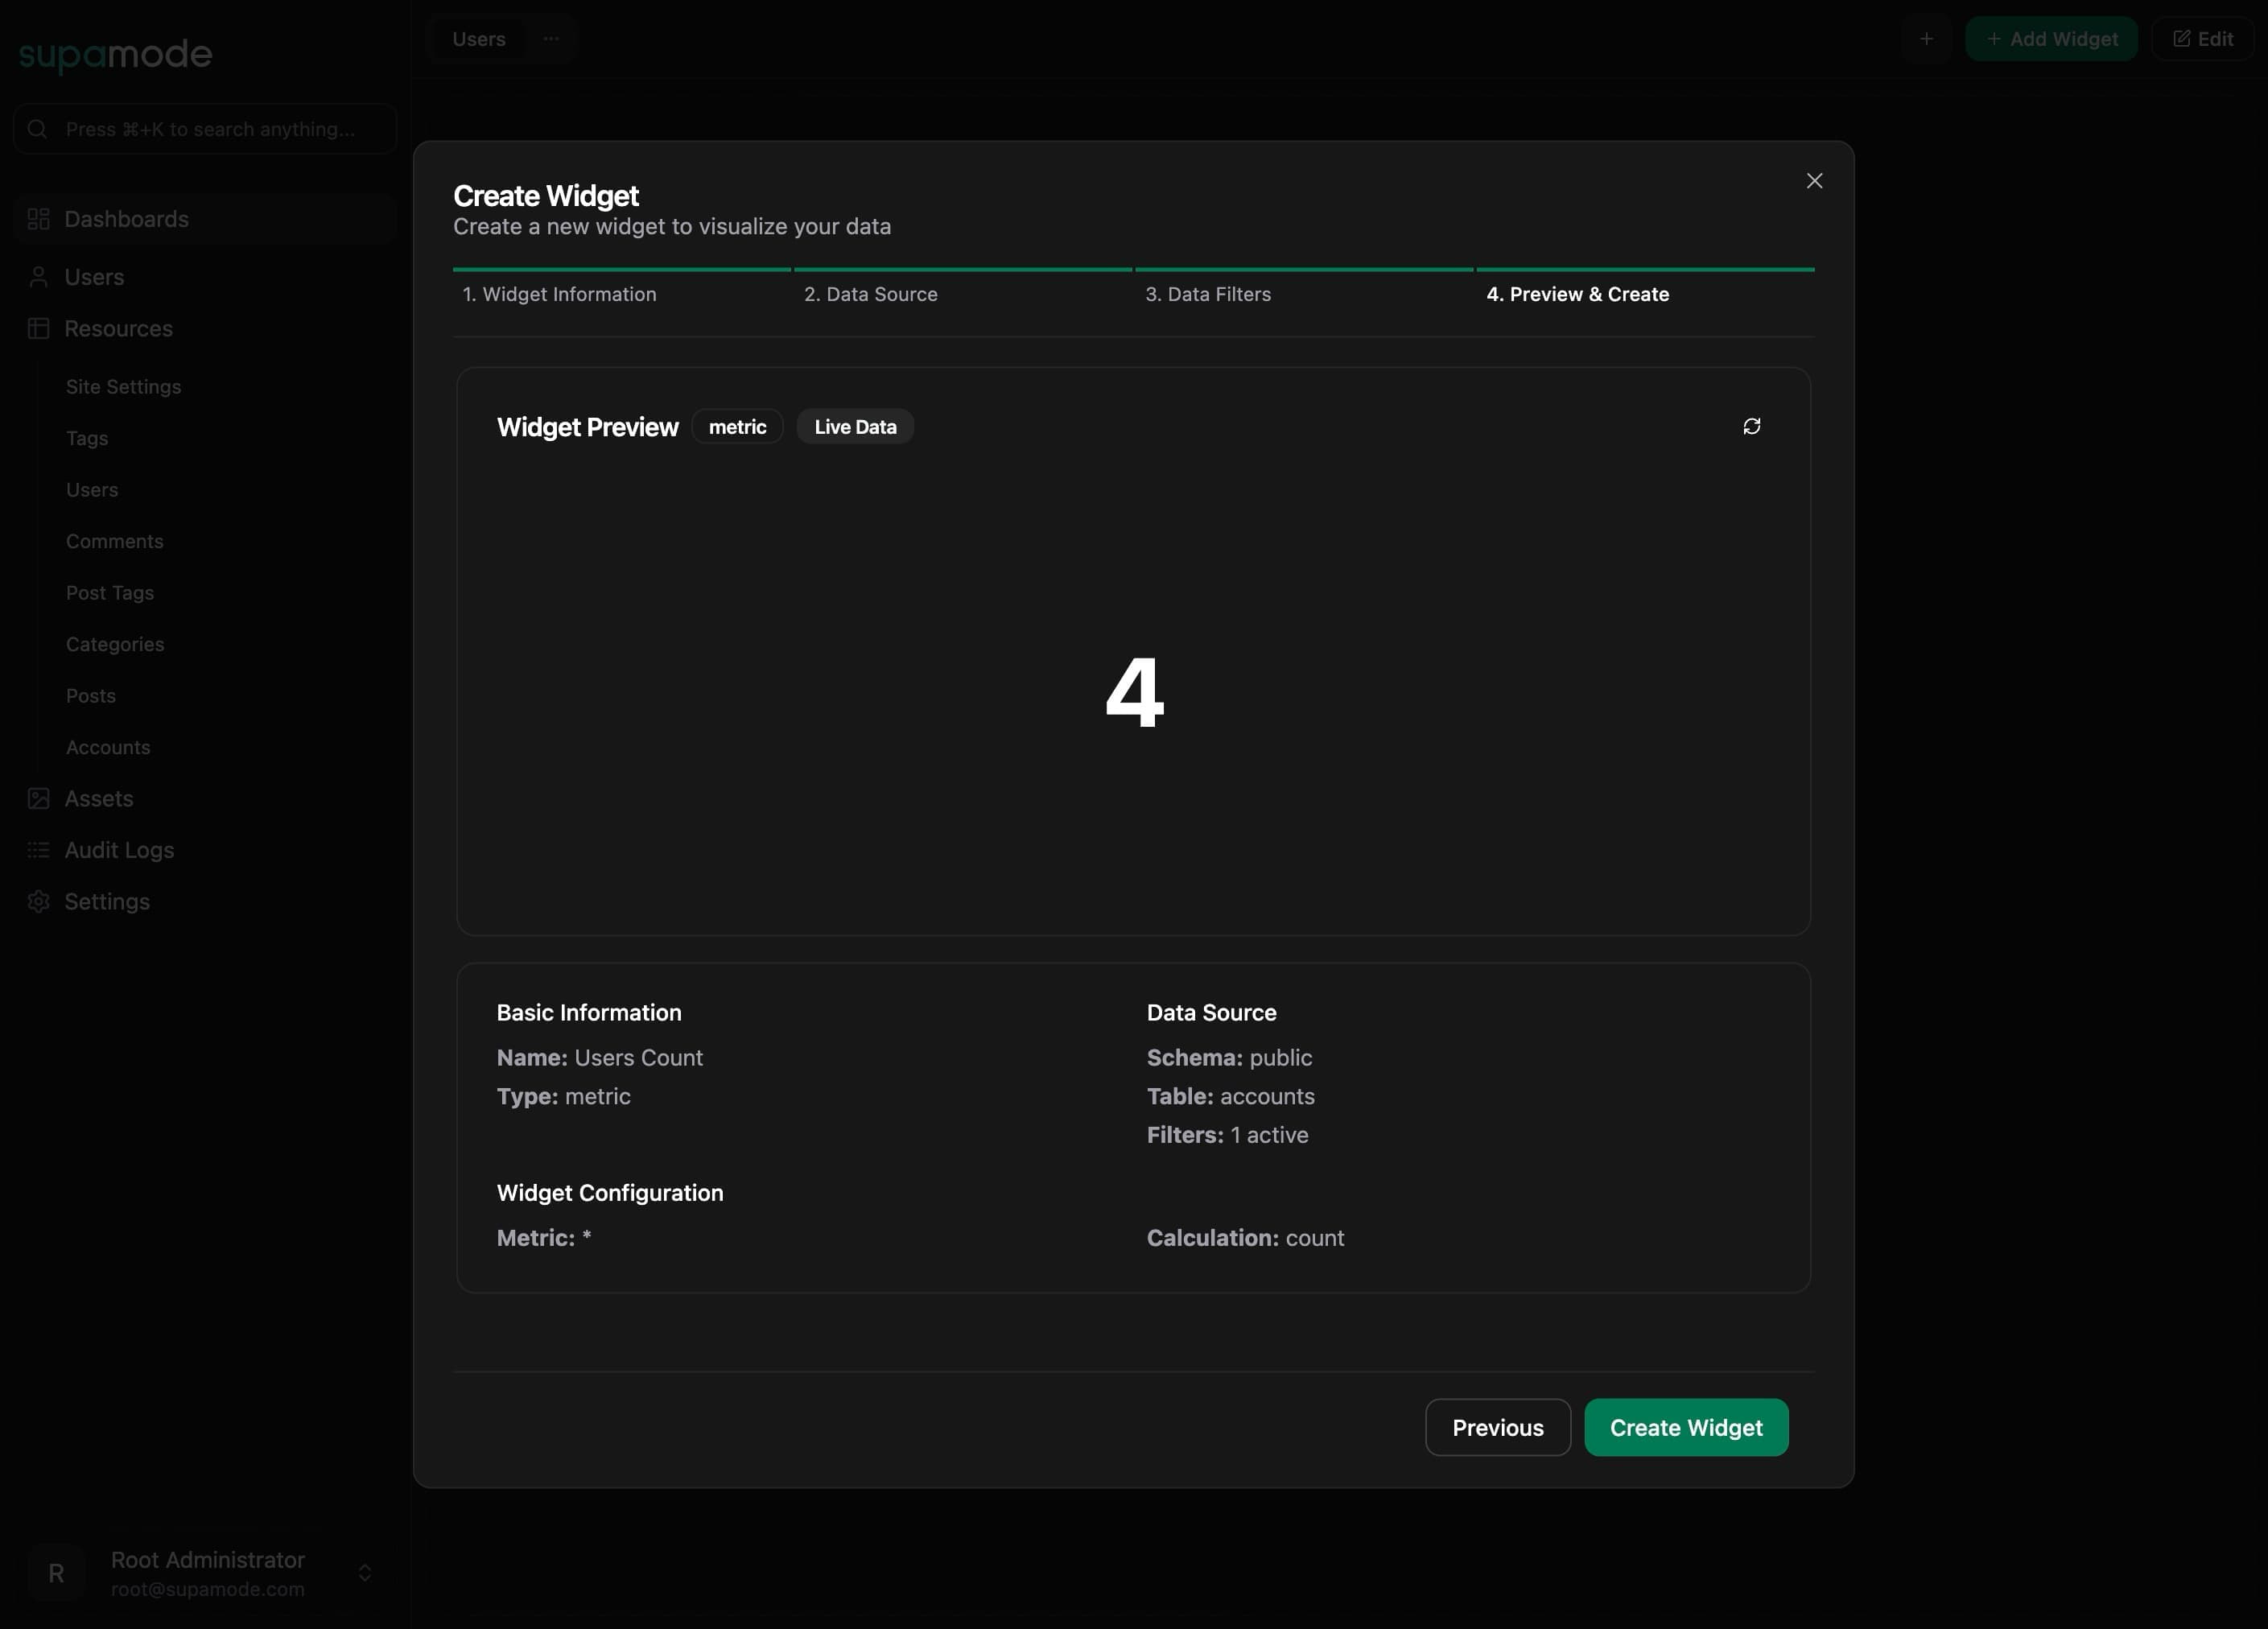
Preview and Create
Step 4: Preview & Create Before finalizing, preview your widget with live data to ensure it displays exactly what you expect.

The preview shows:
- Widget Preview: Live data display with metric/table/chart view options
- Basic Information: Confirms widget name, type, and configuration
- Data Source: Displays schema, table, and active filter count
- Widget Configuration: Shows metric calculation details
Dashboard Management
Dashboard Tabs and Navigation
Supamode allows you to create multiple dashboards and organize them using tabs for easy navigation between different views. Each dashboard can focus on different aspects of your data or serve different audiences.

Dashboard Tab Features:
- Multiple Dashboards: Create separate dashboards like "Posts" and "Users" for different data sets
- Tab Navigation: Easily switch between dashboards using the tab interface
- Dashboard Actions: Right-click or use the dropdown menu to access dashboard management options:
- Rename Dashboard: Update the dashboard name to better reflect its content
- Delete Dashboard: Remove dashboards you no longer need
- Empty State Guidance: New or empty dashboards show helpful guidance with "Add widgets to start visualizing your data"
- Quick Widget Addition: Each dashboard has its own "Add Widget" button for easy expansion
This tabbed interface makes it simple to organize different analytical views while maintaining a clean, professional interface.
Dashboard Grid Layout
Once created, your dashboard uses a fully customizable grid layout that persists across sessions and is completely responsive.

Edit Mode Features:
- Discard Changes: Abandon any unsaved modifications
- Exit & Save: Save your layout and exit edit mode
- Grid Manipulation: Drag and resize widgets as needed
- Real-time Updates: Widgets show live data with update timestamps
Viewing Dashboards
In view mode, your dashboard displays clean, professional widgets with live data.

View Mode Features:
- Add Widget: Quickly add new widgets to expand your dashboard
- Edit: Enter edit mode to modify layout or widget configurations
- Live Data: Widgets automatically update with fresh data
- Responsive Design: Layout adapts to different screen sizes
Widget Actions and Management
Each widget includes a context menu with powerful management options for real-time control and customization:

Widget Action Menu Features:
Refresh Data
- Manual Refresh: Force immediate data refresh for any widget
- Cache Override: Bypass cached data to get the most current information
- Real-time Control: Useful when you need instant data updates for critical decisions
- Performance Optimization: Widgets use intelligent caching to improve performance while allowing manual refresh when needed
Edit Widget
- Configuration Changes: Modify widget settings, data sources, and filters
- Visual Updates: Adjust chart types, column selections, or metric calculations
- Live Preview: See changes immediately as you modify widget settings
- Non-destructive Editing: Test changes without losing your original configuration
Delete Widget
- Clean Removal: Safely remove widgets you no longer need
- Layout Adjustment: Dashboard grid automatically adjusts when widgets are removed
- Confirmation Process: Prevent accidental deletion with user confirmation
Smart Caching System:
- Automatic Caching: Widgets cache data to provide fast loading times
- Intelligent Updates: System automatically refreshes data at appropriate intervals
- On-Demand Refresh: Users can force refresh when immediate data is critical
- Performance Balance: Optimal balance between speed and data freshness
This widget management system ensures that your dashboards remain both performant and current, giving you control over when to prioritize speed (cached data) versus freshness (manual refresh).
Sharing and Collaboration
Custom Dashboards support role-based sharing, allowing you to collaborate with team members while maintaining appropriate access controls.
Sharing Features:
- Role-based Access: Share with specific roles (e.g., Customer Support, Management)
- Permission Levels: Set View or Edit permissions for different roles
- Team Collaboration: Multiple users can view and interact with shared dashboards
- Access Control: Maintain data security with granular permissions
Best Practices
Performance Optimization
- Add time-based filters (e.g., "last 30 days") to improve query performance
- Use specific filters to reduce dataset size for large tables
- Monitor widget update times and optimize slow-loading widgets
Dashboard Design
- Group related widgets logically
- Use consistent naming conventions for widgets and dashboards
- Consider your audience when designing shared dashboards
- Balance information density with readability
Data Management
- Regularly review and update filters to ensure relevant data
- Use descriptive widget names that clearly indicate their purpose
- Consider creating separate dashboards for different use cases or audiences