We're excited to announce Custom Dashboards - a groundbreaking new feature in Supamode that fundamentally transforms how users interact with their data and analytics.
Introducing Custom Dashboards: Your Data, Your Way
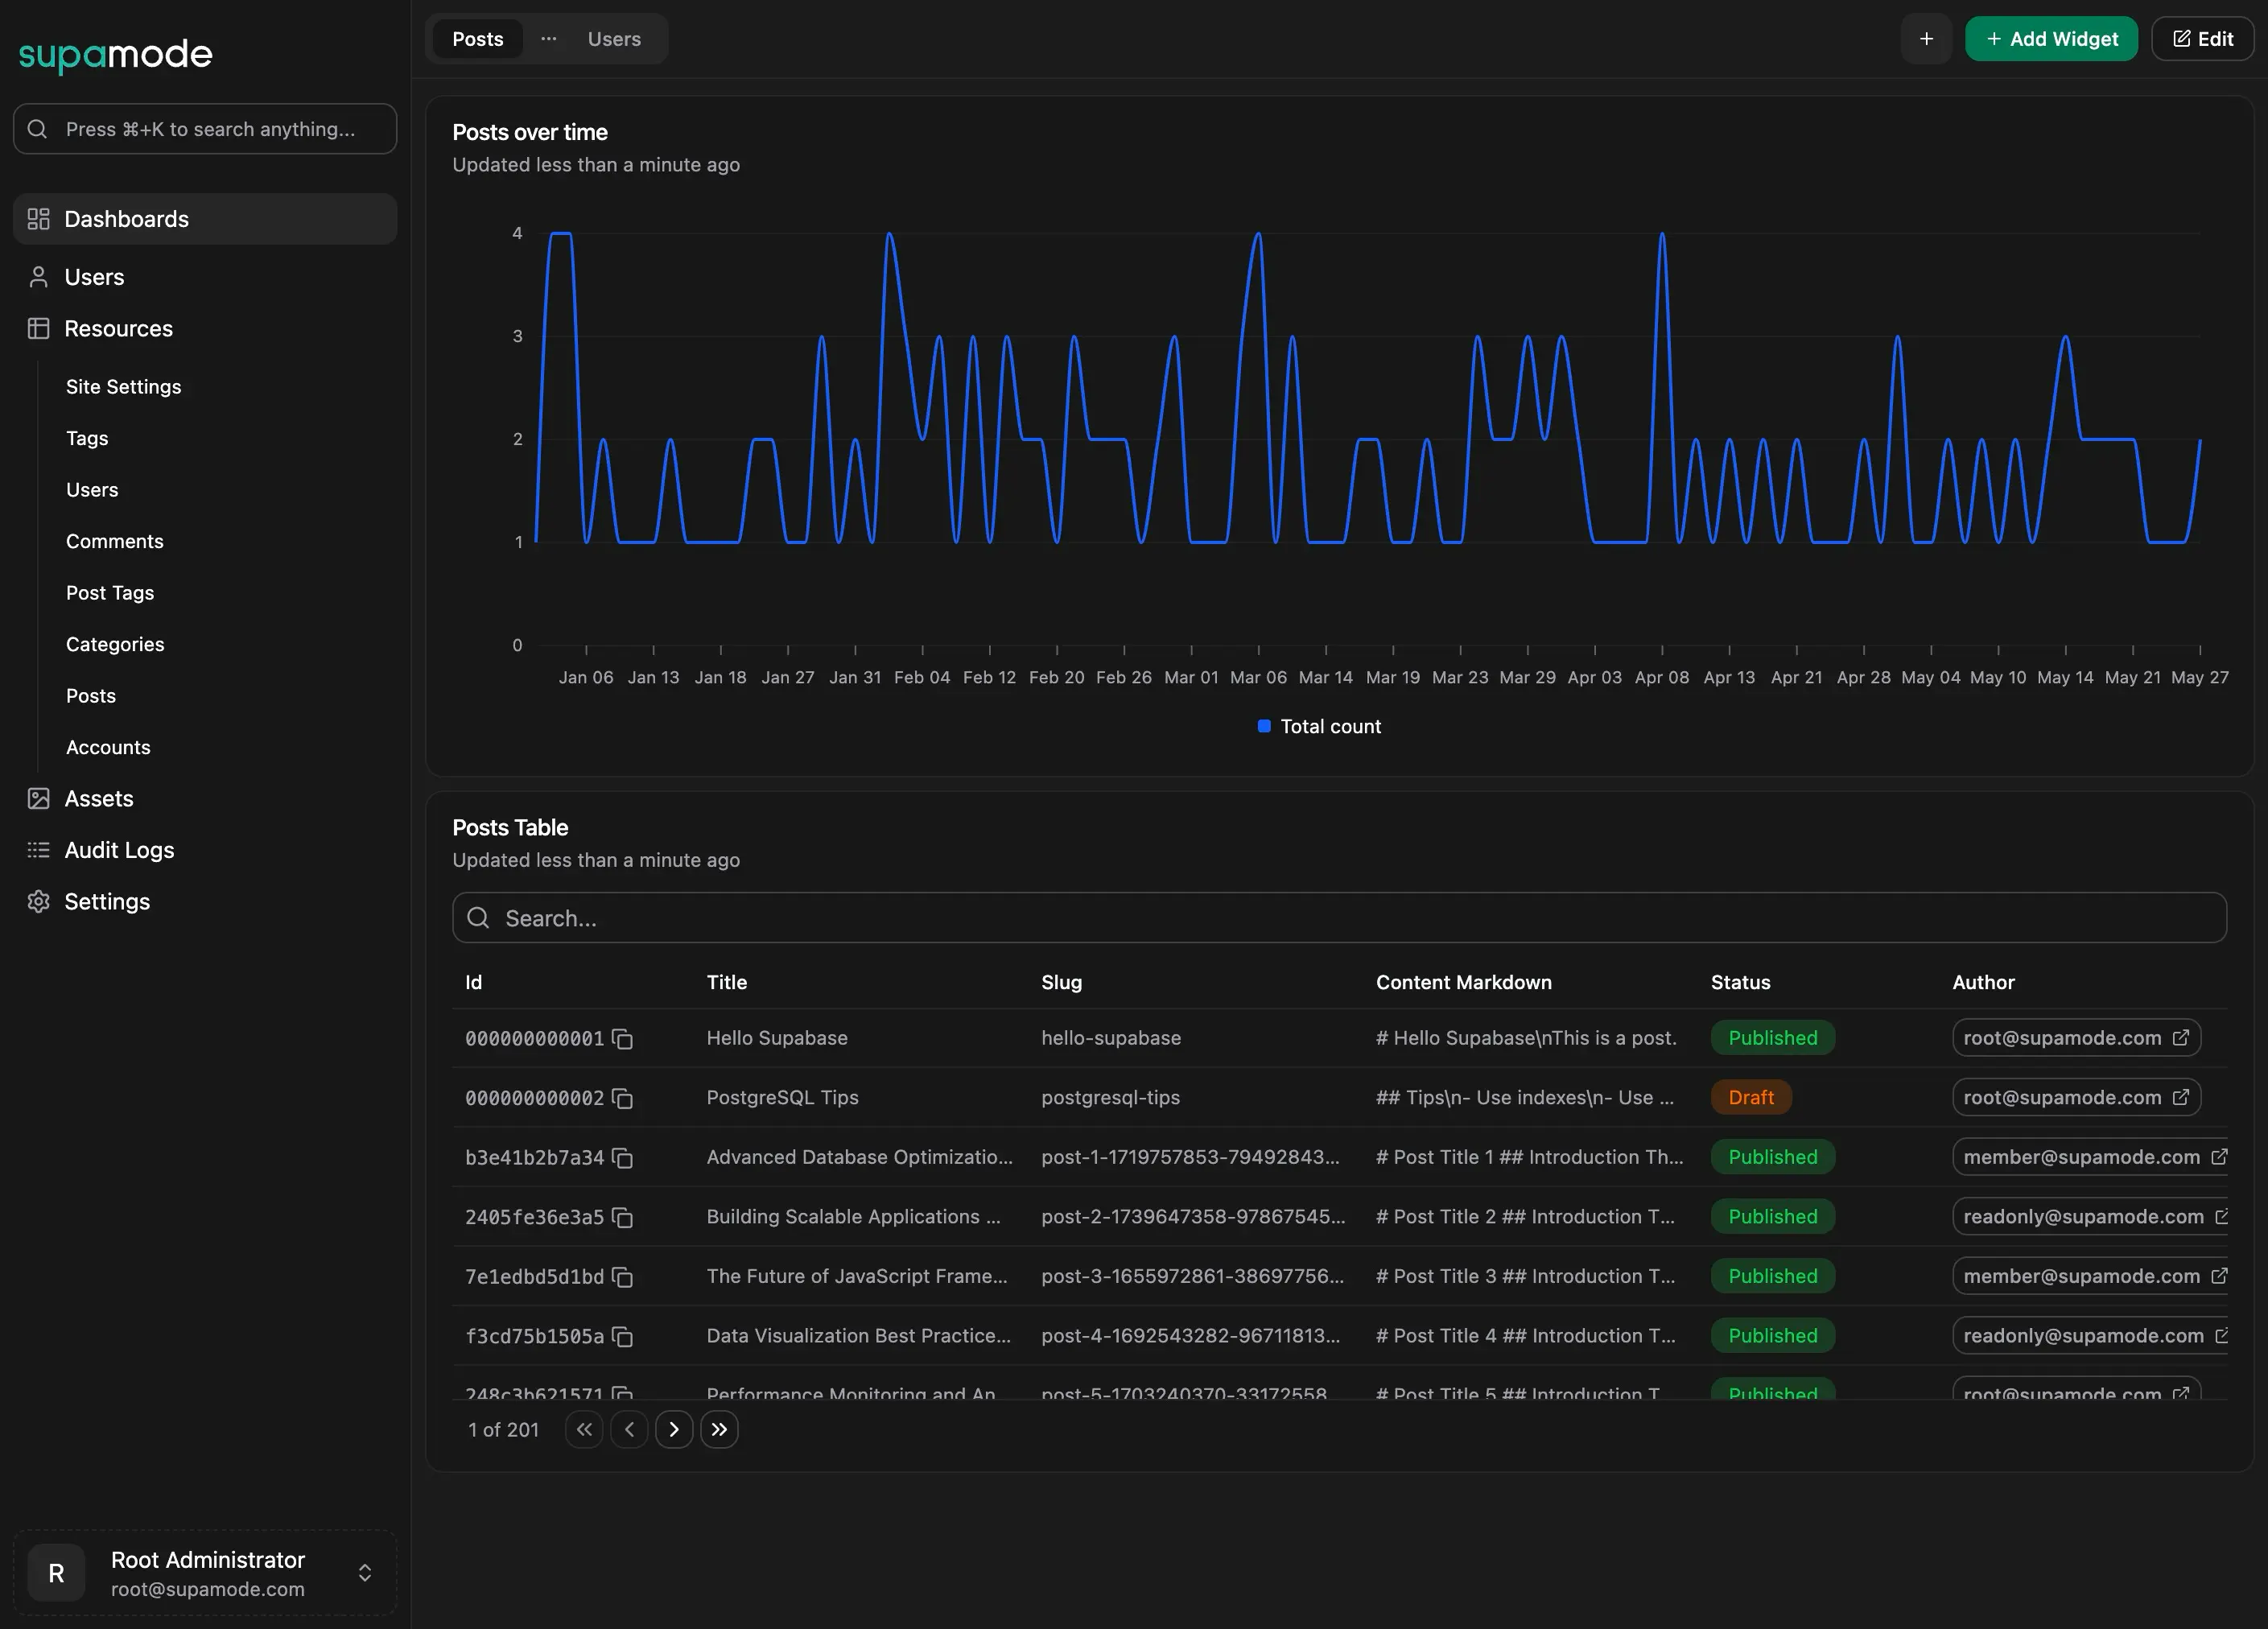
Custom Dashboards provide users with the ability to create personalized, interactive analytics interfaces tailored to their specific needs. Instead of being limited to pre-built views, users can now build their own dashboards with drag-and-drop widgets, custom layouts, and real-time data visualization.
Think of it as having a personal data analyst who understands exactly what information you need, how you want to see it, and when you need it updated. Whether you're tracking user growth, monitoring system performance, or analyzing financial trends, Custom Dashboards adapt to your workflow—not the other way around.
 Click to expand
Key Features
1. Three Powerful Widget Types
We've designed three distinct widget types, each optimized for different analytical needs. This isn't just about pretty charts—it's about choosing the right tool for the right insight.
Chart Widgets: Transform raw data into compelling visual stories that reveal patterns, trends, and relationships at a glance:
- Bar Charts: Perfect for comparing categories side-by-side. See at a glance which regions are driving the most sales, which user plans are most popular, or how different marketing channels are performing. The human brain processes comparative visual information 60,000 times faster than text—bar charts leverage this natural ability.
- Line Charts: Your window into temporal patterns and trends. Watch revenue growth unfold over time, track user signups through seasonal fluctuations, or monitor website traffic patterns. Line charts transform time-series data into intuitive visual narratives that make forecasting and pattern recognition effortless.
- Area Charts: Ideal for understanding composition and accumulation over time. Visualize how total revenue builds up across different product lines, see stacked user types growing your community, or track budget allocation versus spending patterns. Area charts excel at showing both the "what" and the "how much" of your data stories.
 Click to expand
Table Widgets: The detail-oriented powerhouse of your analytical toolkit. When you need to dive deep into your data, table widgets provide the same comprehensive functionality as Supamode's Data Explorer, but embedded directly in your dashboard context:
- Advanced Column Selection: Cherry-pick exactly the columns that matter for your use case. Hide the noise, showcase the signal.
- Intelligent Search & Filtering: Find specific records instantly with built-in search functionality that understands your data structure.
- Scalable Pagination: Handle datasets of any size gracefully, from hundreds to hundreds of thousands of records.
- Rich Interactive Elements: Status indicators, clickable links, copyable IDs, and visual cues that make data navigation intuitive.
- Context Preservation: Unlike switching to a separate data view, table widgets keep you in your analytical flow while providing full data exploration capabilities.
Metric Widgets: Your dashboard's pulse check. These aren't just numbers on a screen—they're carefully calculated insights that tell you exactly what's happening in your business right now:
- Single-Value Clarity: Cut through the noise with crystal-clear metrics like "Total Users: 1,247" or "Monthly Recurring Revenue: $48,392". No interpretation required.
- Trend Intelligence: See not just where you are, but where you're heading. Compare current performance against previous periods to spot acceleration or deceleration before it becomes critical.
 Click to expand
2. Intuitive 4-Step Widget Creation
Data visualization shouldn't require a PhD in statistics or years of experience with complex BI tools. Our guided widget creation wizard democratizes data analysis, making powerful visualizations accessible to everyone on your team:
Step 1: Widget Information Start with intention. Name your widget descriptively ("Q4 Sales Performance" not "Chart 1") and select the widget type that best serves your analytical goal. This initial step sets the foundation for meaningful data exploration.
Step 2: Data Source Connect to your data universe. Choose your schema and table from your Supabase database. Whether you're analyzing user behavior, financial transactions, or system logs, your data is just a click away.
Step 3: Data Filters Here's where the magic happens. Our intelligent filtering system doesn't just let you slice and dice your data—it actively helps you make better decisions. Get performance recommendations like "add a time filter for the last 30 days to improve query speed" or "consider filtering by status to focus on active records." It's like having a database optimization expert looking over your shoulder.
Step 4: Preview & Create See before you commit. Preview your widget with real, live data from your database. No surprises, no "that's not what I expected" moments. What you see in the preview is exactly what you'll get on your dashboard.
 Click to expand
3. Flexible Dashboard Management
Multiple Dashboards: Organize different views with tabbed navigation:
- Create separate dashboards for different data sets (Posts, Users, Analytics)
- Easy tab switching between dashboards
- Dashboard management actions (rename, delete)
 Click to expand
Customizable Grid Layout:
- Drag-and-drop widget positioning
- Responsive design that adapts to any screen size
- Layout persistence across sessions
- Real-time editing with discard/save options
 Click to expand
4. Comprehensive Multi-Widget Views
Combine different widget types for powerful analytical dashboards:
 Click to expand
- Unified Analytics: Charts for trends, tables for details, metrics for KPIs
- Real-time Updates: All widgets refresh with live data automatically
- Cross-Widget Insights: Correlate high-level trends with detailed data
- Professional Interface: Clean, intuitive design for any use case
5. Role-Based Sharing & Collaboration
Share dashboards securely with your team:
- Role-Based Access: Share with specific roles (Customer Support, Management, etc.)
- Permission Levels: Set View or Edit permissions per role
- Team Collaboration: Multiple users can interact with shared dashboards
- Access Control: Maintain data security with granular permissions
 Click to expand
Getting Started: Your First Dashboard in Under 5 Minutes
Ready to transform your data analysis? Here's how to build your first Custom Dashboard:
1. Navigate to Dashboards Head to the Dashboards section in your Supamode workspace. You'll see a clean, inviting interface ready for your first creation.
2. Create Your Dashboard Click "Create Dashboard" and give it a meaningful name. Pro tip: Be specific—"Marketing Weekly Review" is much more useful than "Dashboard 1" six months from now.
3. Add Your First Widget Use our guided widget creation process to add visualizations. Start with a metric widget showing a key number you check daily, then add a chart to show trends, and finish with a table for detailed exploration.
4. Arrange and Customize Use the intuitive drag-and-drop grid system to arrange your widgets exactly how you want them. Resize, reposition, and refine until the layout feels natural for your workflow.
5. Share the Insights Configure role-based permissions to share your dashboard with team members. Marketing dashboards for the marketing team, executive summaries for leadership, operational metrics for the ops team.
The Future of Data Analysis Starts Today
Custom Dashboards represent more than just a new feature - they're a fundamental shift toward democratized, personalized data analysis. Every team member can now have the exact analytical view they need, updated in real-time, without depending on data teams or static reports.
Need guidance? Our comprehensive documentation covers everything from basic setup to advanced configuration techniques.